
Still Missing the Point: What HUD’s New Count Can’t Tell Us About Children, Youth, and Families
HUD says homelessness fell 6.3% this year. But its count leaves out most children, youth, and families experiencing homelessness, and a smaller number doesn’t always mean fewer people are homeless.
On November 6, the U.S. Department of Housing and Urban Development (HUD) announced that its January 2026 Point-in-Time (PIT) count found 698,425 people experiencing homelessness, a 6.3% decrease from the year before and the largest one-year drop HUD has recorded. Headlines quickly declared that homelessness is falling, and dubious explanations for the decline followed just as quickly.
We’ve been here before. Earlier this year, when HUD released its 2025 count, we wrote that treating the PIT count as the measure of homelessness leaves out most children, youth, and families. That is still true. HUD has not yet released its 2026 data on families with children or unaccompanied youth; those will come in its full Annual Homelessness Assessment Report (AHAR). Before those numbers arrive, here is a reminder of what this count can and cannot tell us.
What a one-night HUD PIT count measures
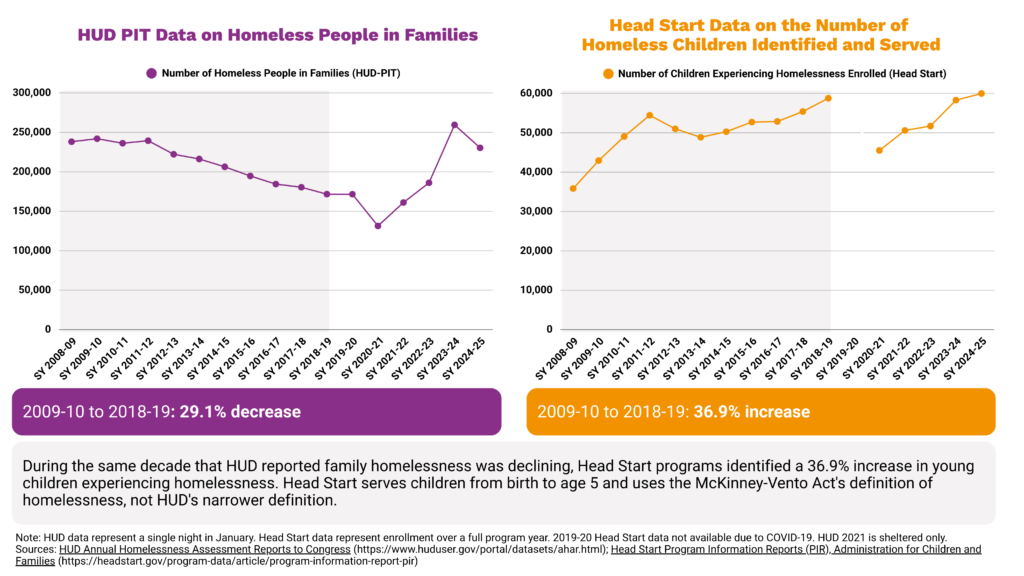
The PIT count includes people staying in shelters or transitional housing, or visibly unsheltered, on one night in January. But most families and youth experiencing homelessness are not in those places. Lack of shelter space, fear of shelter, and fear of family separation lead most families and youth to stay in motels, with other people temporarily, or in other hidden places – situations the PIT count does not include.
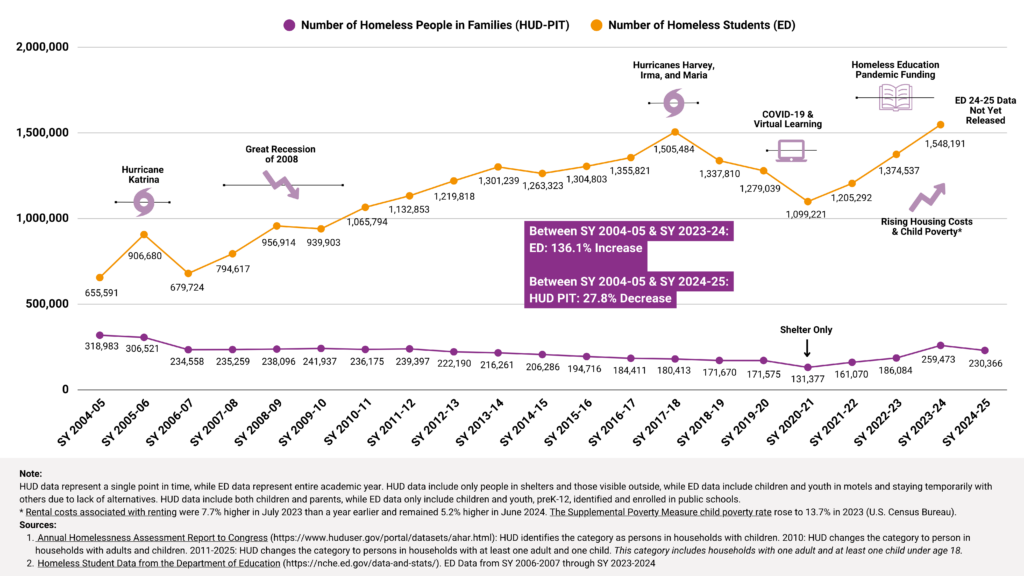
Public schools identified more than 1.5 million children and youth experiencing homelessness in the 2023-2024 school year. Nearly three in four were staying temporarily with other people when they were identified, and more than 8% were in motels. Most don’t meet HUD’s definition of homelessness and don’t appear in its count.
The HUD PIT count goes up and down for reasons unrelated to the prevalence of homelessness
PIT numbers rise and fall for reasons that have nothing to do with whether fewer people are homeless, as HUD’s reports demonstrate. In the 2025 AHAR, Massachusetts reported 1,644 fewer people in homeless families, a 7% drop. The Continuums of Care there attributed the decrease to fewer shelter beds, stricter eligibility rules, and limits on how long families could stay in shelter. In Maryland, family homelessness rose 36%, which Continuums of Care attributed to expanded emergency shelter capacity.
Families who can’t get into shelter rarely end up on the street or in cars, where they risk having their children taken away. They move into cheap motels or stay with others in temporary and often precarious situations. Their homelessness didn’t end when shelter policies or availability changed: they just stopped being counted.
The same thing has happened nationally over time. HUD shifted funding away from transitional housing toward rapid rehousing, and transitional housing beds fell by 60% between 2007 and 2025. People in transitional housing are counted as homeless in the PIT; people in rapid rehousing are not. As that shift happened, families and youth fell out of the count, and the decline was cited as evidence that the approach was working.
What the HUD PIT count misses, even on its own terms
The gap isn’t only about definitions of homelessness. Public schools also identify students staying in shelters, transitional housing, and unsheltered locations, the same kinds of situations HUD counts, and those numbers are rising. In the 2023-2024 school year, schools identified 196,812 students in shelters or transitional housing, 26% more than the year before, and 67,536 unsheltered students, 8% more.
Between school years 2004-05 and 2023-24, HUD data show an 18.7% decrease in people in families who meet its definition of homelessness. Over the same period, public school data show a 136.2% increase overall, and a 40% increase in students staying in shelters, transitional housing, or unsheltered locations. School data also rise and fall with natural disasters, recessions, and the availability of funding.
A smaller HUD PIT count isn’t always progress
A decline in homeless numbers can mean fewer people are homeless. It can also mean fewer shelter beds, stricter rules, less outreach, or fewer volunteers to do the counting. Similarly, smaller numbers identified by public schools can mean loss of funding, changes in staff capacity, lack of training, or non-compliance with federal law. That is why SchoolHouse Connection doesn’t automatically celebrate decreases or decry increases. What matters is whether children, youth, and families are identified and helped, and for most of them, the PIT count can’t tell us that.
Before the full HUD report comes out
When HUD releases its 2026 numbers for families and youth, we encourage reporters, policymakers, and advocates to think critically, and to ask the following questions:
- Did shelter capacity in a community go up or down, and did eligibility rules or time limits change?
- Were families who left shelter placed in housing they could afford with the supports they need to stay housed, or did they move into motels or move in with other people?
- How did funding instability impact the PIT count in 2026?
- What are local schools, early childhood programs, and youth-serving programs seeing in the same community?
Understanding who’s missing from the HUD PIT count
Public schools identified more than 1.5 million homeless children and youth in the 2023-2024 school year. An estimated 513,539 infants and toddlers experienced homelessness in the 2023-24 program year. At least 1.5 million college students reported experiencing homelessness in 2019, according to the National Center for Education Statistics. These numbers appear nowhere in most media coverage of HUD’s count. As a result, children, youth, and families experiencing homelessness are written out of the story – and out of the solutions.
What You Can Do
- Ask reporters and policymakers to include school, early childhood, and youth program data when they talk about homelessness, through letters to the editor, conversations with reporters, and meetings with local, state, and federal policymakers.
- Urge national, state, and local advocacy organizations to represent all people experiencing homelessness in their reports and statements.
- Urge your members of Congress to support four bipartisan actions:
- Pass the Homeless Children and Youth Act (HCYA), which would align HUD’s definition of homelessness with the definitions other federal agencies use for children and youth, remove barriers to HUD assistance, and bring greater visibility to family and youth homelessness.
- Provide flexible funding for early childhood programs and public schools to offer housing-related help directly to families and youth, such as utilities, short-term rental assistance, motel stays, and help finding housing. The bipartisan Emergency Family Stabilization Act is one model.
- Pass the bipartisan Family Stability and Opportunity Vouchers Act, which would create 250,000 housing vouchers over five years for families with young children who have experienced homelessness or housing instability.
- Pass the Runaway and Homeless Youth and Trafficking Prevention Act (S.3125/H.R. 6041), which would update and reauthorize the Runaway and Homeless Youth Act to prevent trafficking and expand housing and services for youth.
Related Resources
- Missing the Point: When Media, Advocates, and Policymakers Use Data That Exclude Children and Youth
- The Pitfalls of HUD’s Point-in-Time Count for Children, Youth, and Families
- Child and Youth Homelessness Data Profiles
- More Than 1.5 Million Students Experienced Homelessness. Public Schools Identified and Supported Them.