
More Than 1.5 Million Students Experienced Homelessness. Public Schools Identified and Supported Them.
Public schools identified more than 1.5 million children and youth experiencing homelessness in 2023–2024. Here are six key trends from the latest federal data on identification, attendance, graduation, and more.
Recently released federal data show that public schools identified more than 1.5 million children and youth experiencing homelessness in the 2023-2024 school year, the highest number since national reporting began in 2004. This number is a critical measure of both the scale of child and youth homelessness, and the fact that when schools have the resources and capacity to identify and support students, more children and youth experiencing homelessness are enrolled, attending, and on a path to success.
The data also show some progress in reducing chronic absenteeism and improving high school graduation for students experiencing homelessness – significant trends in light of increased numbers and need. Taken together, the data demonstrate both the scale of the challenge and the importance of sustained investment and targeted support to help students experiencing homelessness enroll, attend, and succeed in school. Dedicated support matters not only for immediate educational stability, but also for longer-term homelessness prevention: lack of a high school degree or GED is the single greatest risk factor for homelessness as a young adult. This makes targeted resources, policies, and effective practices critical for preventing future homelessness and for closing academic achievement gaps.
New Federal Data on Student Homelessness: Six Major Trends from the 2023–2024 School Year
1. Public schools identified over 1.5 million children and youth experiencing homelessness in the 2023-2024 school year. This is the highest number on record, surpassing pre-pandemic numbers.
- The number of identified homeless students increased by 12.63% over the previous school year, by 28.5% over the past two school years, and by 11.6% since the 2018-2019 school year.
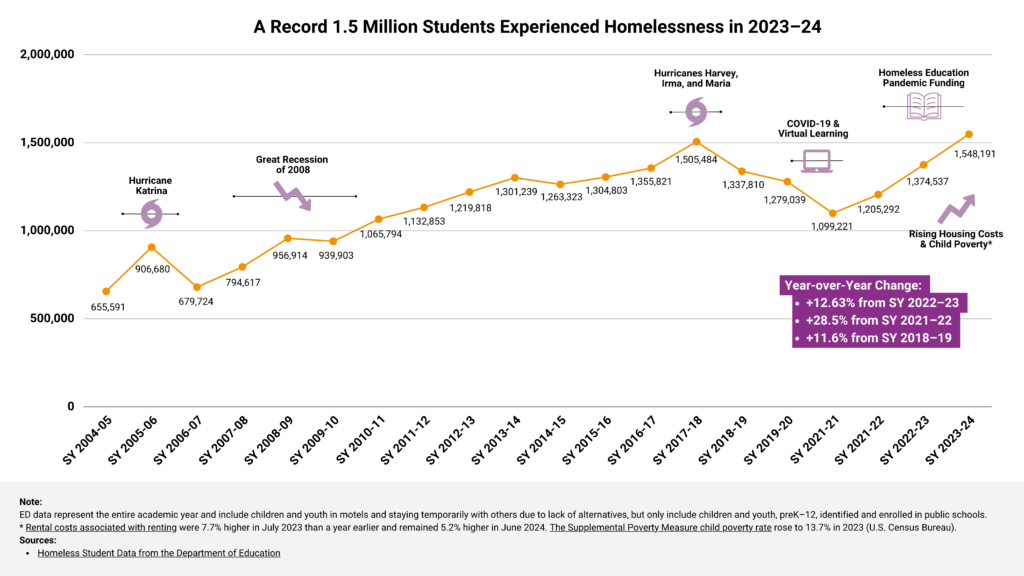
- As sobering as these numbers are, there is strong evidence that homelessness in public schools remains under-identified, and that the true scale of child and youth homelessness is even larger – particularly considering that infants, toddlers, and other young children are not fully represented in the data.[1]
- The increase in identification coincided with three notable conditions: significantly increased federal funding for homeless education, growing economic pressures on families, and major natural disasters.
- The American Rescue Plan Homeless Children and Youth program, created by a bipartisan and unanimous amendment, provided $800 million for identifying and supporting homeless students over a three-year time period (for most states, between June 2021 and September 2024). This one-time investment more than doubled the number of school districts receiving dedicated resources to identify students experiencing homelessness, respond to urgent needs, and strengthen school stability. More than twice as many school districts were able to receive dedicated funding through ARP-HCY as under the annual McKinney-Vento Education for Homeless Children and Youth (EHCY) program.
- The 2023-2024 school year unfolded during a period of elevated housing costs and broader financial strain for families. According to the U.S. Census Bureau, the real median gross cost of renting – rent plus the average monthly cost of utilities and fuels adjusted for inflation – grew faster annually (3.8%) than real median home values (1.8%) in 2023. This was the largest annual real increase in rental costs since at least 2011. The Census Bureau also reported that the Supplemental Poverty Measure child poverty rate rose to 13.7% in 2023.
- Wildfires, floods, and hurricanes likely contributed to localized increases in student homelessness in certain states, such as in Hawaii, Florida, Texas, and Vermont.
- An increase in the identification of homeless students that results from more resources, capacity, and better identification is evidence of impact and progress. Conversely, a decrease in homeless numbers does not necessarily mean progress in reducing homelessness – it also can mean lack of resources, outreach, and proactive identification. Children and youth must first be identified as experiencing homelessness in order to receive the protections and services they need to enroll, attend, and succeed in school – and to decrease their risk of experiencing homelessness as adults.
2. During the 2023-2024 school year, nearly half of the nation’s 1.5 million students experiencing homelessness were chronically absent – a modest improvement over the previous few years, but still significantly higher than other low-income students.[2]
- 47.7% of students experiencing homelessness were chronically absent in the 2023-2024 school year. This is a 3.1% decrease over the previous two school years, but still eleven percentage points higher than the 2018-2019 school year.

- The reduction in chronic absence, while modest, occurred during a period when public schools were identifying many more students experiencing homelessness and had more resources to support their attendance. Some of those newly identified students may already have missed substantial school before schools knew they were homeless. That means the recent improvement in chronic absenteeism may actually understate progress.
- National 2023-2024 data on chronic absence rates are not yet available for economically disadvantaged students. However, in every one of the 31 states that have publicly reported chronic absenteeism data for both students experiencing homelessness and for economically disadvantaged students, students experiencing homelessness had a substantially higher chronic absenteeism rate in the 2023-2024 school year – on average, the homeless student chronic absence rate was 16.43% higher than for economically disadvantaged students.[3] Because some states may count students experiencing homelessness within the economically disadvantaged subgroup, this comparison likely understates both the size of the gap and the distinct effect of homelessness on chronic absenteeism.
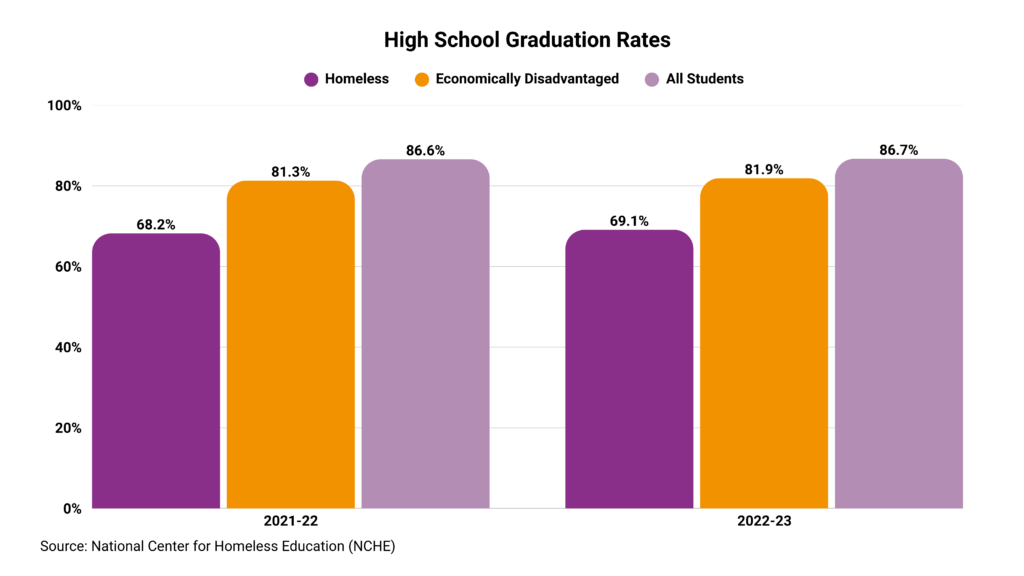
3. The 2023-2024 national average graduation rate for homeless students was 70.1%, an increase of one percent over the previous year, and 2.1% since the pandemic. However, the gap between students experiencing homelessness and other low-income students persists.
- The improvements in high school graduation rates for homeless students occurred at the same time that public schools identified significantly more students experiencing homelessness.
- While 2023-2024 high school graduation rates are not available yet for economically disadvantaged students, 2022-2023 data show that the gap between students experiencing homelessness and other low-income students is persistent.
- The 2022-2023 homeless student graduation rate (69.1%) was 12.8% percentage points below other low-income students, and nearly 17.6% percentage points below all students.
4. In the 2023-2024 school year, only 12.71% of homeless students were staying in shelters or transitional housing when they were first identified by schools as experiencing homelessness.
- Most were staying temporarily with other people, often referred to as “doubled-up” (74.32%), while others were staying in hotels or motels (8.53%) or in unsheltered situations (4.36%). Homeless families and youth who stay temporarily with others, or in self-paid motels, due to lack of adequate alternatives are not eligible for homeless assistance from the U.S. Department of Housing and Urban Development (HUD).
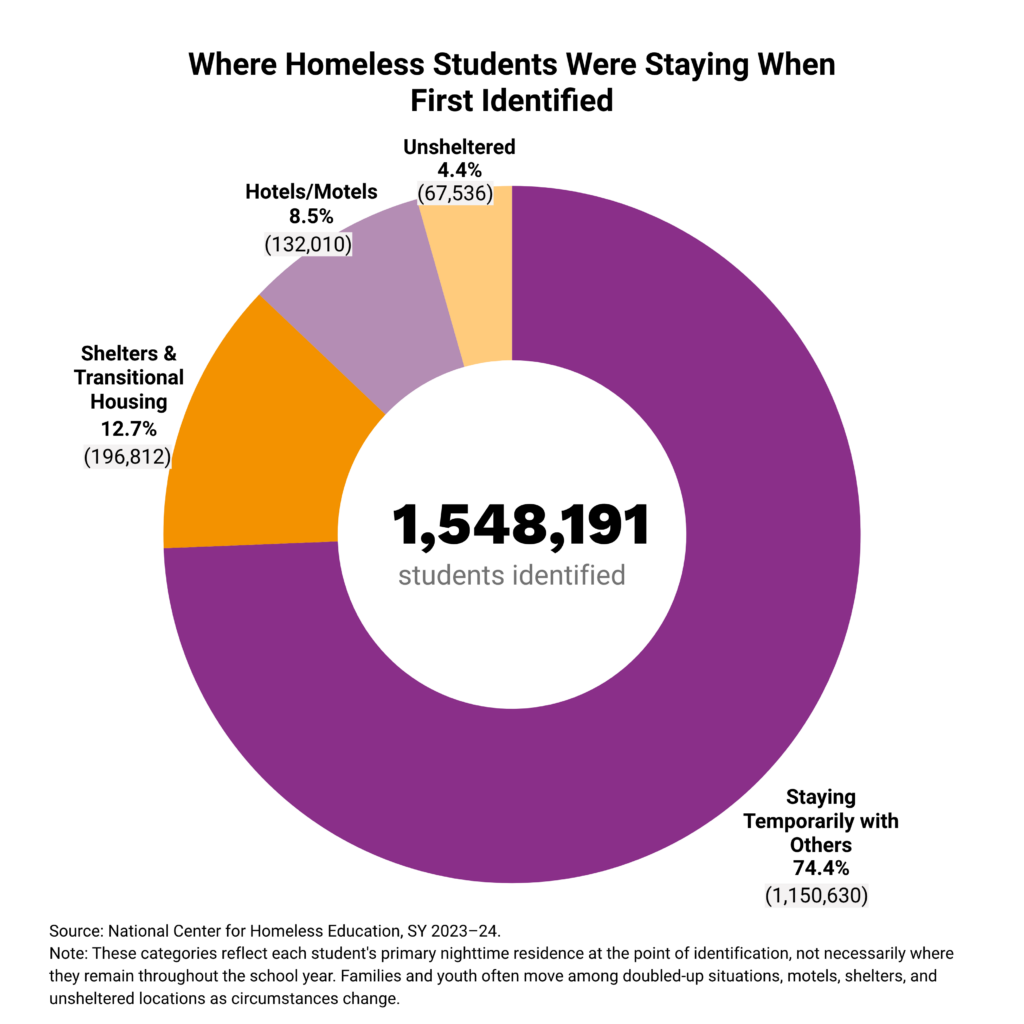
- These categories are not static. They reflect students’ primary nighttime residence at the point of identification, not necessarily where they remain throughout the school year; families and youth often move among these living situations.
- Compared to before the pandemic, public schools identified more homeless students across every primary nighttime residence category. Although most students were doubled-up when first identified in 2023-2024, that share declined somewhat, from 76.3% in 2018-2019 to 74.3% in 2023-2024, while larger shares were staying in motels, shelters or transitional housing, or unsheltered situations.
- The increase in motel stays is especially notable, rising from about 7.0% of identified homeless students in 2018-2019 to 8.5% in 2023-2024, an increase of 34,370 students. This may reflect both rising homelessness and the temporary availability of ARP-HCY funds, which for the first time could be used for emergency motel stays through September 2024. Many schools and communities regarded that flexibility as highly stabilizing for children and youth, especially in rural areas. Congress recently directed the U.S. Department of Education to issue guidance clarifying that EHCY funds may be used for short-term emergency motel stays on a case-by-case basis if there are no other resources available and if tied to school attendance.
5. The number of identified unaccompanied homeless youth (youth who are experiencing homelessness on their own, without a parent or guardian) has rebounded since the pandemic.
- Public schools identified 127,848 unaccompanied homeless youth in the 2023-2024 school year, representing 8.3% of all enrolled homeless students.
- These numbers represent a 3.1% increase over the previous year, and 15.5% over the past two years. Compared to pre-pandemic numbers in 2018-19, these numbers represent a slight increase of 1.7%.
- Unaccompanied homeless youth were consistently more likely than homeless students overall to be identified staying temporarily with others (doubled-up): 84.5% doubled-up versus about 74.3% overall. They were far less likely to be identified in hotels or motels: 2.3% in hotels/motels versus about 8.5% overall. They also tended to be somewhat less likely to be in shelters (9.6% in shelters/transitional housing versus about 12.7% overall) or unsheltered situations (3.7% unsheltered versus about 4.4% overall).
- These patterns in primary nighttime residence for unaccompanied homeless youth are consistent throughout the 2018-2019 to 2023-2024 period.
6. The number of young children ages 0 to 5 identified and served through Education for Homeless Children and Youth (EHCY) subgrants reached a record high in 2023-2024.
- Local educational agencies (LEAs) receiving EHCY subgrants reported identifying and serving 84,883 children from birth to age 5 who were not yet enrolled in kindergarten in the 2023-2024 school year. This was a 13.3% increase over the previous year and a 45.3% increase over the prior two years, the highest number reported to date.
- The largest increases occurred during the period when ARP-HCY funds were available. LEAs receiving regular EHCY subgrants were especially well positioned to benefit from ARP-HCY, because ARP Homeless I could be used to supplement existing EHCY subgrants and ARP Homeless II was distributed broadly by formula to reach the vast majority of LEAs. That likely gave many EHCY subgrantee districts substantially greater capacity to identify and serve young children experiencing homelessness during this period.
- These figures likely understate the number of young children experiencing homelessness who were served by school districts in some way, because this dataset includes only children served through EHCY subgrants, and only 20% of all LEAs receive EHCY subgrants due to the national funding amount for the EHCY program.
- All LEAs, regardless of whether or not they receive an Education for Homeless Children and Youth (EHCY) subgrant, are required to collect and report data on the number of children age 3-5 identified as experiencing homelessness who are enrolled in an LEA-administered preschool program, but who are not yet in kindergarten. These LEA numbers are not yet available.
About the Data
This brief draws primarily on the National Center for Homeless Education (NCHE’s) newly released national data summary for the 2023-2024 school year, as well as prior NCHE reports used for pre-pandemic comparisons. Because these reports aggregate data reported by schools, LEAs, and state educational agencies (SEAs), additional analyses will be possible once the full SEA and LEA data files are released.[4] SEA and LEA files will also allow SchoolHouse Connection and U-M Poverty Solutions to update our interactive homeless student data profiles, which let users explore data at the local level, including within congressional and state legislative districts. The data profiles allow users to explore important data on student identification and under-identification, graduation rates, chronic absenteeism, and trends over time.
Footnotes
[1] Daniel D. Shephard, Crystal C. Hall, and Cait Lamberton, “Increasing Identification of Homeless Students: An Experimental Evaluation of Increased Communication Incorporating Behavioral Insights,” Educational Researcher 50, no. 4 (May 2021): 239-248, ERIC; Hadass Moore, Ron Avi Astor, and Gordon Capp, “Districts’ and Schools’ Role in Identifying and Providing Services for Homeless Students: Nested Ecological Case Studies in School Districts with High- and Low-Socioeconomic Status,” Journal of Community Psychology 51, no. 3 (2023): 1124-1148, full text; Amy DiPierro and Corey Mitchell, “Hidden Toll: Thousands of Schools Fail to Count Homeless Students,” Center for Public Integrity, November 15, 2022, article
[2] In this article, we use “low-income” and “economically disadvantaged” interchangeably for ease of reading. “Economically disadvantaged” is the term used in federal education data and refers to students who meet the definition established by their state.
[3] From Attendance Works and SchoolHouse Connection’s forthcoming analysis of publicly available state-level data on chronic absenteeism. States include: AZ, CA, CO, CT, DE, DC, GA, HI, ID, IL, IA, KS, KY, LA, ME, MD, MI, MO, MT, NJ, NM, ND, OH, OR, RI, SC, SD, UT, VA, WA, WV
[4] Please note that national figures are not subject to the same suppression standards as SEA and LEA files and may reflect different de-duplication methods. As a result, there may be small differences between national totals and SEA- or LEA-level data files.